


The challenge
The Agile Business Consortium is the professional body for business agility. It publishes the AgilePM, AgileBA, AgilePgM and AgileDS qualifications, and its flagship, AgilePM, has seen more than 150,000 exams sat worldwide since 2011. The exams are administered and sold by APMG, which also accredits the training providers that prepare candidates to sit them.
That arrangement means the sales data sits with APMG. The Consortium had no insight into how sales divided across the categories that matter: which regions, which products, and which training providers. Without that, it was hard to say where the portfolio was strong, where it was slipping, or whether newer products were catching on.
What we did
We worked from APMG’s sales data and built a suite of dashboards around three questions.
Where are sales coming from? A long-term historical view of sales by region, so shifts that take years to show up become visible.
What is selling? The same history by product type, including how newer products have been taken up since launch.
Who is driving it? Sales by accredited training provider, so the Consortium can see which providers are growing and which are declining.
Each view runs across the full history rather than a recent snapshot. That makes it possible to tell a real change in direction from a bad quarter.
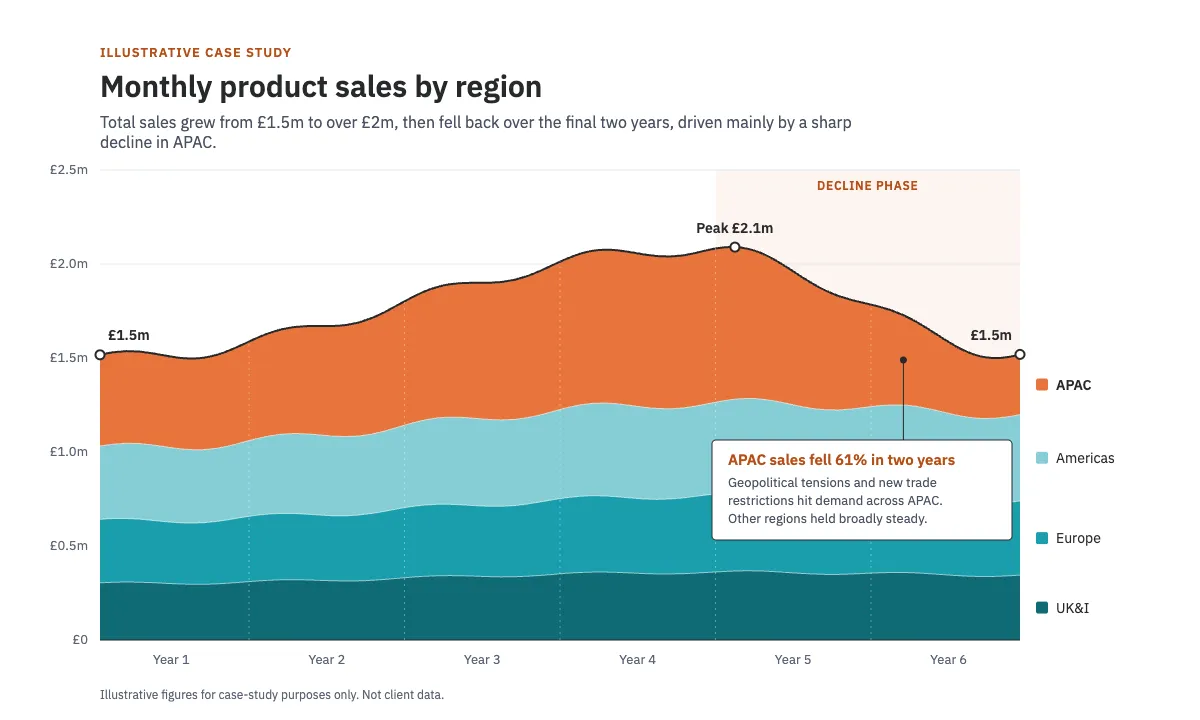
An illustration of the regional view, using made-up figures. It is not client data.
Results
The dashboards turned up three things the Consortium could not see before.
There had been substantial shifts in sales between regions. The picture is different from the one a single global total suggests.
It was now clear which products were performing and which were not, and whether new products were being taken up successfully.
Among training providers, the dashboards showed who was growing and who was declining. The movement among the larger providers mattered most, because a change at a large provider has a bigger effect on overall sales than a change among the smaller ones.
The bigger gain was in the relationship with APMG. The dashboard suite became a working tool for the two organisations. With a shared, detailed view of the sales picture, the Consortium can engage APMG on strategy and support it, instead of reacting to reports it could not interrogate.