

Total membership growth tells you where you are heading. Acquisition, retention and segmentation tell you why.
What does total growth tell you?
Top-line membership growth is worth measuring. Tracked over time, it shows whether your member numbers are rising or falling, and it gives you a base for projecting next year’s membership.
On its own, it answers one question: are we getting bigger or smaller? A board planning next year’s activity needs more than that. It needs to know what is driving the number, and whether that driver will still be there in twelve months.
Three techniques answer that question, and each one builds on the last. Measure acquisition and retention separately. Track both over time. Then segment them.
What sits underneath total growth?
Every change in total membership comes from two movements: new members arriving and existing members leaving. Acquisition rate measures the first, as new members divided by the members you started the period with. Retention rate measures the second, as the share of those starting members still with you at the end.
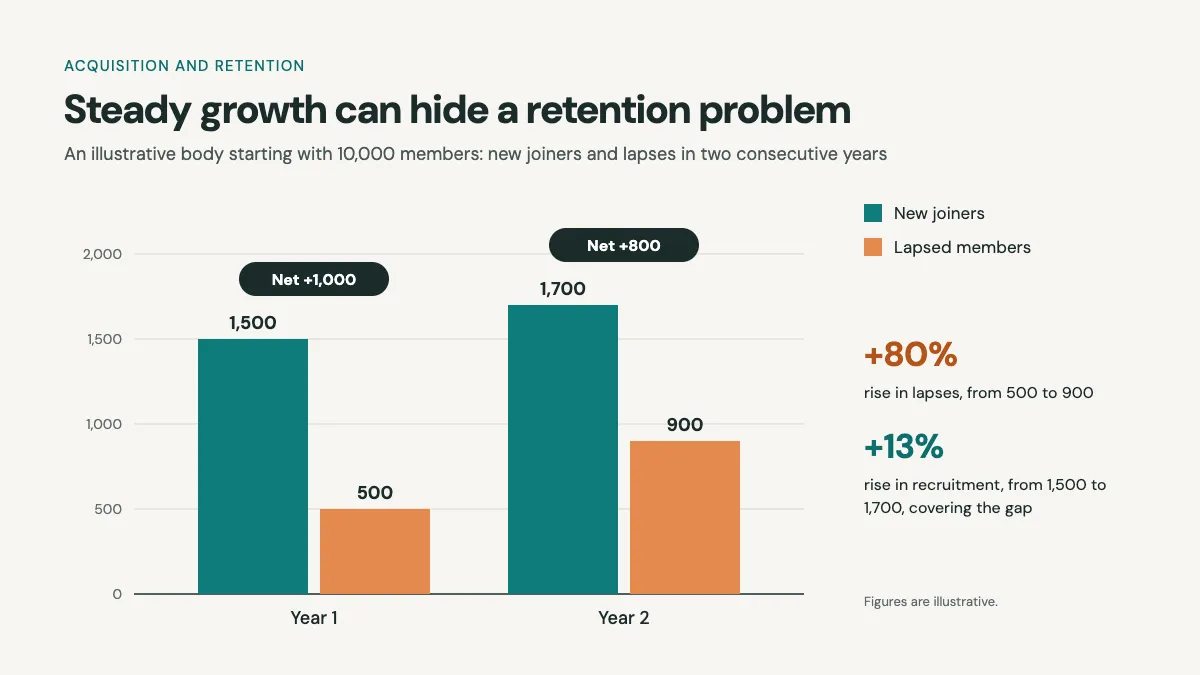
Seen separately, the two can tell a different story from the total. Take an illustrative body with 10,000 members. In one year it recruits 1,500 and loses 500, so membership rises by 1,000. The next year it recruits 1,700 and loses 900, so membership rises by 800.
Total growth is positive in both years. Lapses have nearly doubled, and a rise in recruitment has covered the gap. A board looking only at the total sees steady growth. A board looking at both movements sees a retention problem that recruitment is masking.
Why do trends matter more than a single year?
A single year’s acquisition rate is a number. Five years of it is a pattern you can read. Is acquisition climbing or flattening? Did retention dip after a fee change, or after a move to monthly payment? Do the swings follow the economy, or your own campaigns?
A run of years also gives your forecasting something solid to stand on. With five years of acquisition and retention, you can model what next year’s membership looks like if recruitment slips by a given amount, and plan for each scenario.
Trends only work when the definitions stay the same from year to year, so record how each rate is calculated and apply it consistently.
What does segmentation add?
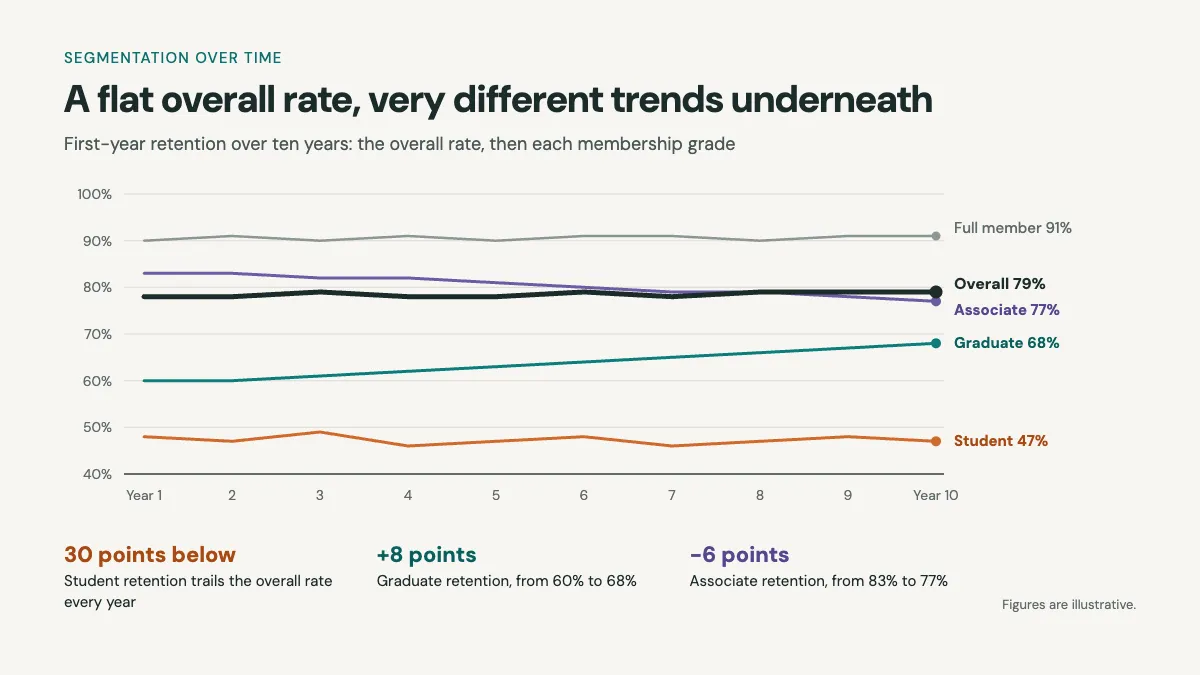
Averages conceal. Splitting each measure by the groups that make up your membership brings the detail forward: grade, region, age band, how members joined and how they pay.
That lets you ask questions an overall rate cannot answer:
- What is the retention rate of members in their first year?
- How many new members are signing up by direct debit?
- Are any membership grades in decline?
Each answer points to an action. Weak first-year retention points to onboarding. A shrinking grade points to its price or proposition. A rise in direct debit joiners points to how your payment mix will change your renewal pattern.
How RICS applied all three
We applied all three techniques with RICS, a UK membership body of more than 100,000 members.
Acquisition rate and readmission rate (the share of former members who rejoin) were missing from their reporting, and neither could be trended over time. We built both, and they now see all their key metrics over time by geography, region, grade and payer type.
That has changed what their teams can do: they take operational action on what the numbers show, and they use the evidence for future benchmarking and strategy.
Questions to ask of your own membership
Try these on your own membership data:
- What was your acquisition rate in each of the last five years?
- What is your readmission rate, and how has it moved?
- What is retention among members in their first year?
- Which grades or regions are growing, and which are shrinking?
- How do new members pay, and does that differ from your longer-standing members?
If several of these are hard to answer today, that points to where to start.